

Search “what does a 750 FICO score mean in Canada” and you’re already working from the wrong assumption. FICO is an American company, and its scoring models weren’t built for the Canadian credit system at all. Neither was VantageScore, the other big US name that gets thrown around constantly in credit advice written for an American audience. Canadian credit bureaus run their own proprietary scoring models entirely, on their own scale, and mixing up the two systems is one of the most common sources of bad advice a Canadian reader can stumble into online.
- The Scale Itself, And Why It Isn’t Borrowed From The US
- The Full Equifax Chart
- The TransUnion Chart Looks Completely Different
- Why Your Own Number Can Differ Between The Two Charts Anyway
- What Actually Changes At Each Tier Boundary
- Business Credit Scores Run On An Entirely Different Scale
- Reading Your Own Number Against The Right Chart
This article is the full reference, the actual Canadian scale, the complete tier chart for both bureaus, and what genuinely changes as your number moves from one band to the next.
The Scale Itself, And Why It Isn’t Borrowed From The US
Canadian credit scores run from 300 to 900, a full 50 points wider at the top than the 300-to-850 scale most Americans see. That gap isn’t cosmetic. Canada’s bureaus don’t license the official FICO or VantageScore systems at all, running their own proprietary models instead, the Equifax Risk Score and TransUnion’s own equivalent, each built specifically around Canadian lending data rather than adapted from an American one. Any advice built around the phrase “a 670 FICO score” doesn’t translate directly to a Canadian file, since FICO and VantageScore are US-specific systems built for American lending data, not the model actually producing the number Canadian lenders pull.

The Full Equifax Chart
| Score range | Tier | What it generally means |
|---|---|---|
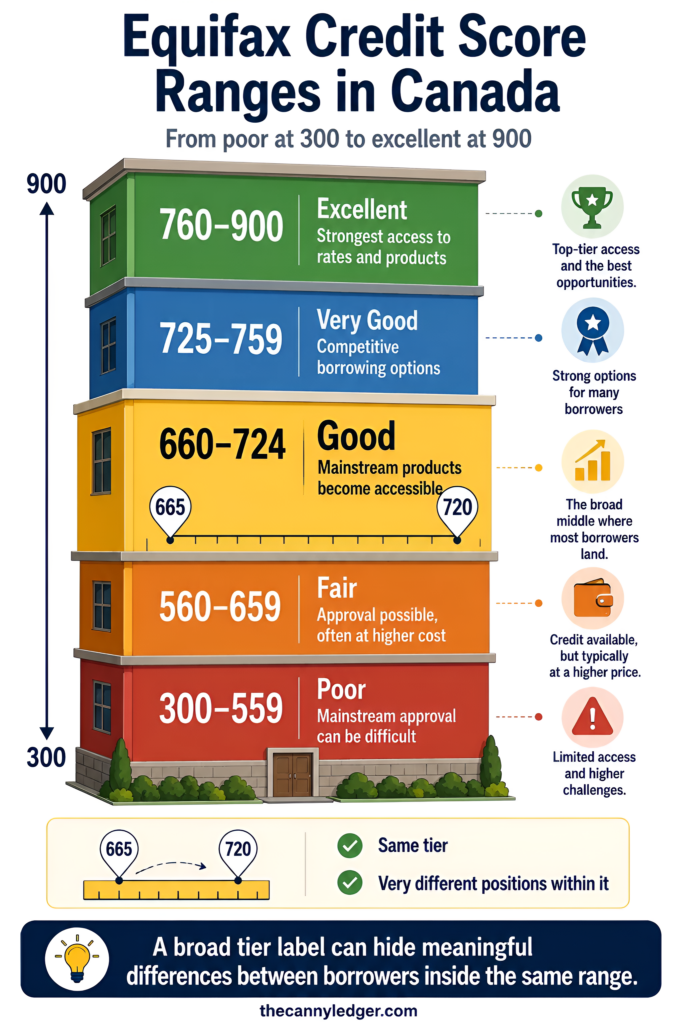
| 300 to 559 | Poor | Mainstream lenders typically decline, alternative lenders charge a real premium |
| 560 to 659 | Fair | Approval possible but usually outside the big banks |
| 660 to 724 | Good | Standard products available from mainstream banks and credit unions |
| 725 to 759 | Very good | Competitive rates on most products, though not always the top tier |
| 760 to 900 | Excellent | Access to the lowest rates and broadest product selection |
This is the chart most free apps and lenders in Canada default to, since Equifax’s Risk Score is the more widely referenced of the two bureaus’ models. It’s worth sitting with how much room exists inside that 660-to-724 good band specifically, since a full 64-point range gets flattened into one label, and a 665 sits meaningfully closer to fair than a 720 does, even though both technically qualify as good.
The TransUnion Chart Looks Completely Different
Here’s where a single number can genuinely mean two different things depending on which report you’re holding. TransUnion uses the identical 300-to-900 numerical scale, but its tier boundaries sit considerably higher across every band.
| Score range | Tier |
|---|---|
| 300 to 692 | Poor |
| 693 to 742 | Fair |
| 743 to 789 | Good |
| 790 to 832 | Very good |
| 833 to 900 | Excellent |
A 700 lands comfortably inside Equifax’s good tier and simultaneously sits in TransUnion’s fair tier on the exact same numerical scale. Neither chart is more correct than the other. They’re two separate proprietary models measuring similar underlying behaviour and drawing their tier lines in different places, which is part of why comparing your own score against a friend’s, or against a number you saw in an unrelated article, only works if you’re both looking at the same bureau’s chart.

Why Your Own Number Can Differ Between The Two Charts Anyway
Even setting the different tier boundaries aside, your actual Equifax score and your actual TransUnion score are rarely identical to begin with, sometimes differing by 20 to 50 points for the same person on the same day. Not every lender reports to both bureaus, so each one is working from a slightly different underlying file, and a discrepancy that size, stacked on top of the different chart boundaries, is exactly why the same person can look like a comfortably good borrower on one report and a merely fair one on the other.

What Actually Changes At Each Tier Boundary
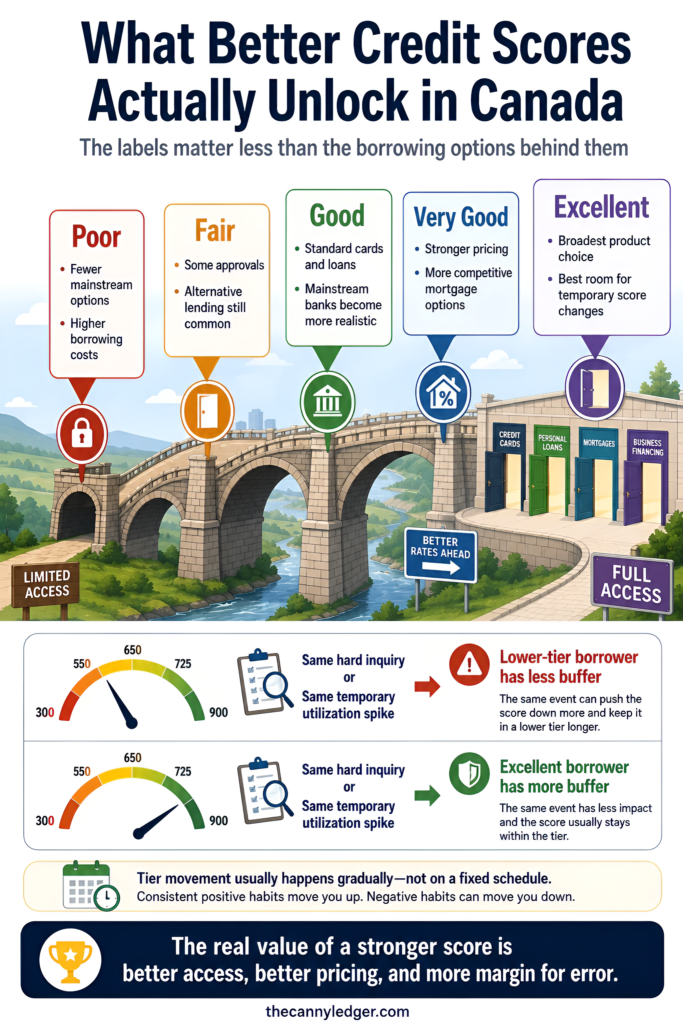
The labels matter less than what they unlock in practice, and that’s where a chart alone stops being useful without real context attached. Moving from fair into good on either scale generally opens the door to standard credit cards and personal loans from a mainstream bank rather than an alternative lender. Moving from good into very good tends to matter most for mortgage pricing specifically, since many lenders reserve their sharpest rates for borrowers well clear of the good tier’s lower half. Very good into excellent buys the most room for error, a temporary utilization spike or a new hard inquiry is far less likely to knock an excellent score down into a materially worse tier than the same event would for someone sitting at the bottom of good.
None of these tier transitions happen on a fixed schedule. Length of credit history alone means most Canadians climb through these bands gradually over years rather than jumping tiers in a single reporting cycle, and a genuinely damaged file, one with a recent bankruptcy or a string of missed payments, can sit in poor or fair for a stretch that feels much longer than the underlying six-to-seven-year retention period on any single negative mark.
Business Credit Scores Run On An Entirely Different Scale
Worth knowing if you operate a business alongside your personal finances, business credit scores in Canada don’t share this 300-to-900 personal scale at all. Commercial credit scoring runs on its own separate system with its own separate range, tracked independently of whatever your personal Equifax or TransUnion number happens to be. Treating the two as interchangeable, or assuming a strong personal score automatically implies a strong business one, is a mistake worth avoiding specifically if you’re applying for financing under a company name rather than your own.

Reading Your Own Number Against The Right Chart
Confirm which bureau produced the number you’re looking at before comparing it against either chart above, since the same score can land in different tiers depending on the source. If a mortgage, broker, or affordability calculation is on your horizon, ask directly which bureau the lender pulls from rather than assuming your Equifax number is the one that matters everywhere. And if your number is sitting in the lower half of fair or poor on either chart, that’s a signal worth acting on through credit counselling or a structured plan like debt consolidation, and if a personal loan is part of that rebuilding plan, knowing which tier you’re actually working from changes what terms are realistically on the table, rather than waiting for the number to drift upward on its own over years you don’t need to spend waiting.

