

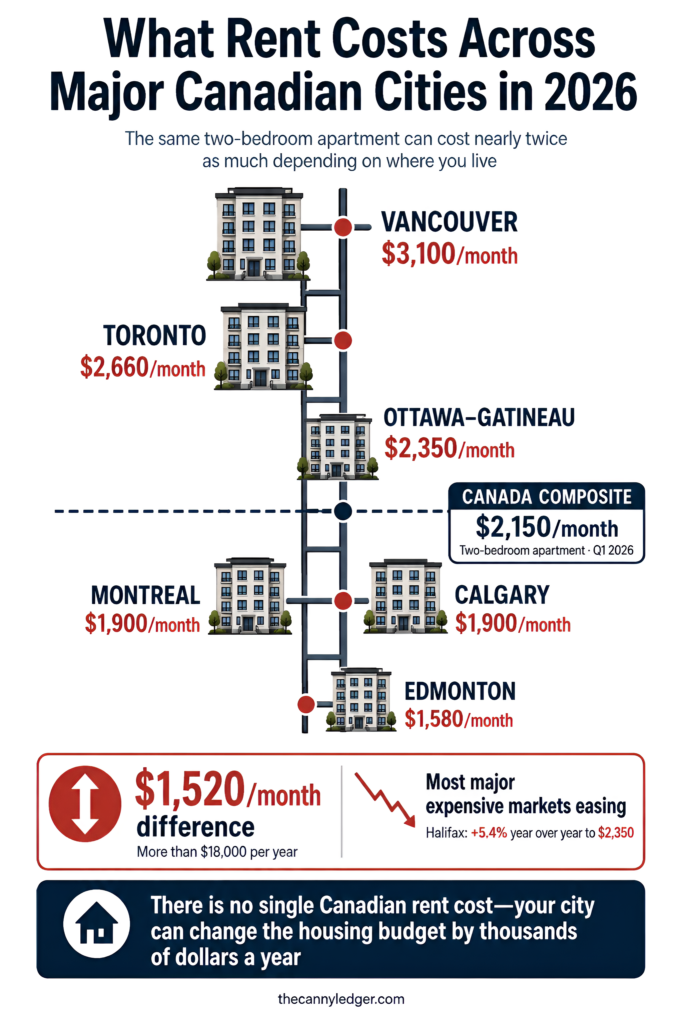
A two-bedroom apartment in Vancouver costs $3,100 a month right now. The same style of unit in Edmonton runs $1,580. Statistics Canada’s own Quarterly Rent Statistics program put those numbers on the board for the first quarter of 2026, and the near-double gap between two major Canadian cities says more about what “cost of living in Canada” actually means than any single national figure could. There is no one number. There’s a country-wide range wide enough to swallow an entire second rent, and where you land inside that range depends almost entirely on which city you’re asking about.
This guide breaks that range down by category, housing first since it moves the needle hardest, then groceries, income, and how all three fit together into a number you can actually use to plan around.
What Rent Actually Looks Like Across The Country Right Now
Statistics Canada’s national composite figure for a two-bedroom apartment sat at $2,150 in the first quarter of 2026, down a modest 0.9 percent from the same quarter the year before. That single average buries enormous variation underneath it. Toronto came in at $2,660, Vancouver at $3,100, and Ottawa-Gatineau at $2,350. On the more affordable end, Montreal and Calgary both landed at $1,900, and Edmonton at $1,580, the lowest among the major metros StatCan tracks. Halifax stood out as the one city moving against the national trend, up 5.4 percent year over year to $2,350, a genuine outlier in a period when most major markets were cooling.
The direction of movement matters as much as the level. Most of the country’s biggest, most expensive markets were easing in early 2026, driven by rising vacancy rates and new supply catching up to a few years of aggressive demand. Rentals.ca’s own August 2026 report corroborates that pattern, showing continued annual declines in Vancouver and Calgary even as Toronto’s market showed early signs of a turnaround. Halifax and a handful of Prairie cities were moving the opposite way, still absorbing population growth faster than new housing supply could keep pace. Winnipeg’s own rent trajectory has followed that Prairie pattern rather than the Toronto-Vancouver cooling trend, and our page on average rent in Winnipeg tracks the specific local number in more depth than a national comparison can.
Groceries Have Been The Quiet Driver For Nearly A Year And A Half
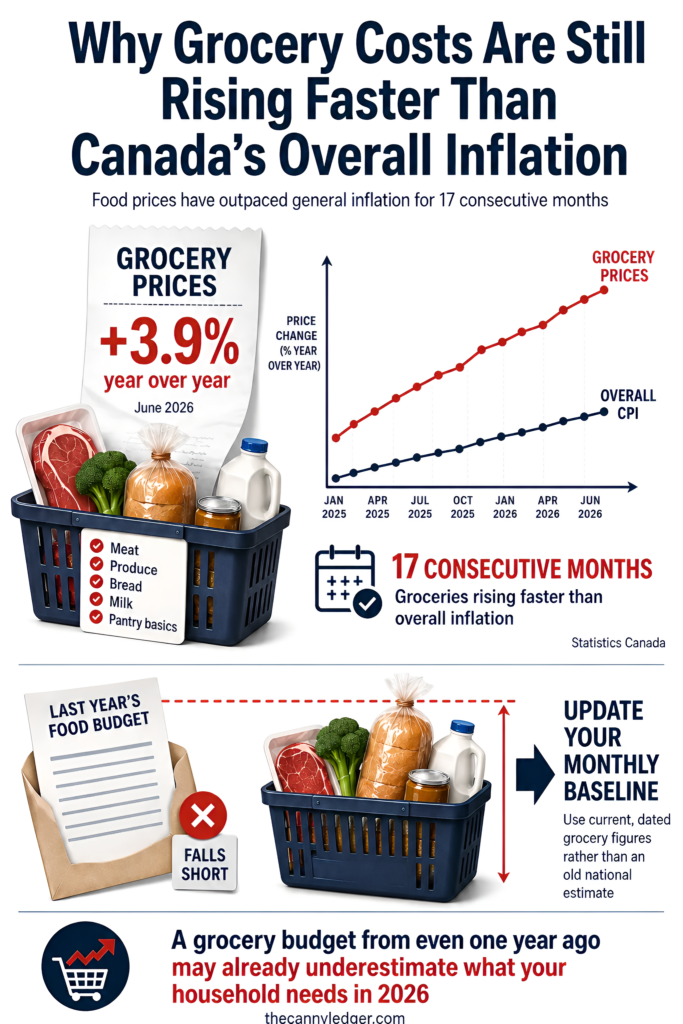
Rent gets most of the attention, but grocery inflation has been the more persistent problem underneath the headline number. Statistics Canada’s June 2026 Consumer Price Index report showed grocery prices up 3.9 percent year over year, and that month marked the seventeenth consecutive month grocery inflation outpaced the overall CPI. That’s not a single bad month or a temporary spike tied to one product category. It’s a sustained, year-and-a-half-long stretch where the cost of food specifically has climbed faster than prices in general, which means a household budget built around last year’s grocery line item is almost certainly already out of date. Our own breakdown of the average grocery bill in Winnipeg reflects current local pricing rather than a stale national estimate.
The Income Side Of The Equation Matters As Much As The Costs
None of these cost figures mean much without something to measure them against. The standard affordability benchmark caps housing at 30 percent of gross income, which means the income required to comfortably afford Vancouver’s $3,100 rent looks nothing like what’s needed for Edmonton’s $1,580. A household would need roughly $124,000 in annual gross income to keep Vancouver rent at that 30 percent threshold, against closer to $63,000 for the identical unit type in Edmonton, a gap that widens further once groceries, transportation, and everything else get layered on top of housing alone.
This is exactly the calculation a living wage tries to formalize on a city-by-city basis, and Manitoba’s own numbers make the point concretely. Winnipeg’s calculated living wage reached $19.77 an hour for 2025, while Manitoba’s legal minimum wage sits at $16.00, a real, measurable gap between the legal floor and what the actual cost of living in this specific city requires, one that grows or shrinks meaningfully depending on which Canadian city you’re actually pricing your household against.

Building Your Own National Comparison
Start with rent specifically, since it’s the single largest, most variable line item, and use StatCan’s own quarterly figures rather than a crowdsourced estimate if you’re comparing cities seriously, since asking rents on listing platforms and StatCan’s methodology can diverge from what a specific unit actually rents for. Layer grocery costs on top using a current, dated figure rather than a number from even a year ago, given how persistently food prices have been climbing relative to everything else. Anchor the whole comparison against your actual income rather than a national median, since a $19.77 living wage in Winnipeg and a comparable figure in Vancouver or Toronto would look nothing alike once local rent gets factored in. And if you’re weighing a genuine move between cities, run the full comparison, rent, groceries, transportation, and income together, rather than fixating on a single headline number that, as this whole picture shows, rarely tells the complete story on its own.