

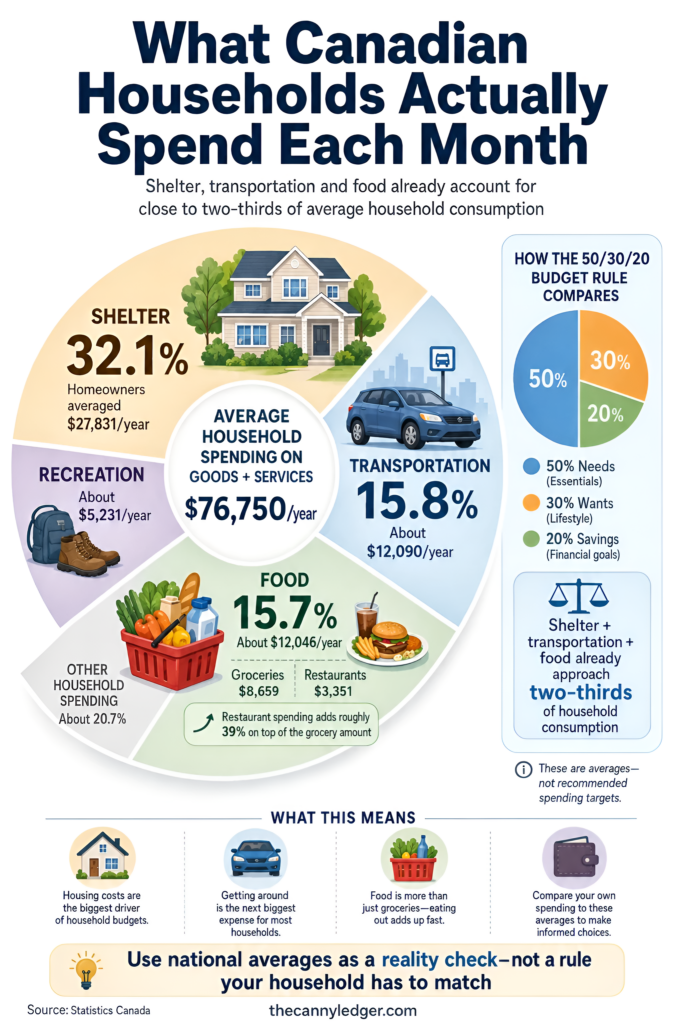
The popular 50/30/20 budgeting rule assumes needs eat roughly half of an average paycheque. Statistics Canada’s own Survey of Household Spending tells a different story, with shelter alone accounting for 32.1 percent of total household consumption, transportation another 15.8 percent, and food 15.7 percent, three categories that together already consume close to two-thirds of the average Canadian household’s spending before a single dollar goes toward anything most people would call a want. Any calculator built around the generic 50 percent needs assumption is quietly out of step with how Canadian households actually spend, and building your own budget around real numbers instead of an imported rule of thumb produces a far more useful result.
What StatCan’s own data actually shows by category, the free federal tool built specifically for this job, and how to construct your own monthly calculator using real figures rather than borrowed percentages, all matter more than picking a single catchy rule and stopping there.
What Canadian Households Actually Spend, By The Numbers
The most recent full data set, covering 2023, puts average household spending on goods and services at $76,750 for the year, and the category breakdown underneath that total is worth sitting with directly. Shelter led every category at 32.1 percent of consumption, and homeowners specifically spent an average of $27,831 on shelter costs that year. Food came to $12,046 in total, split between $8,659 on groceries and $3,351 on restaurants, a split worth noting since the grocery portion alone is what most budgeting advice focuses on while restaurant spending quietly adds another 39 percent on top. Transportation reached $12,090, and recreation, often the first category people try to cut, still averaged $5,231 across the year.
None of these are targets to hit. They’re a reality check, a way to see whether your own budget is unusually out of line with a category or whether you’re actually tracking close to a typical Canadian household and the real problem is that typical spending itself has become genuinely difficult to sustain on a typical income.
The Federal Government Already Built A Free Calculator
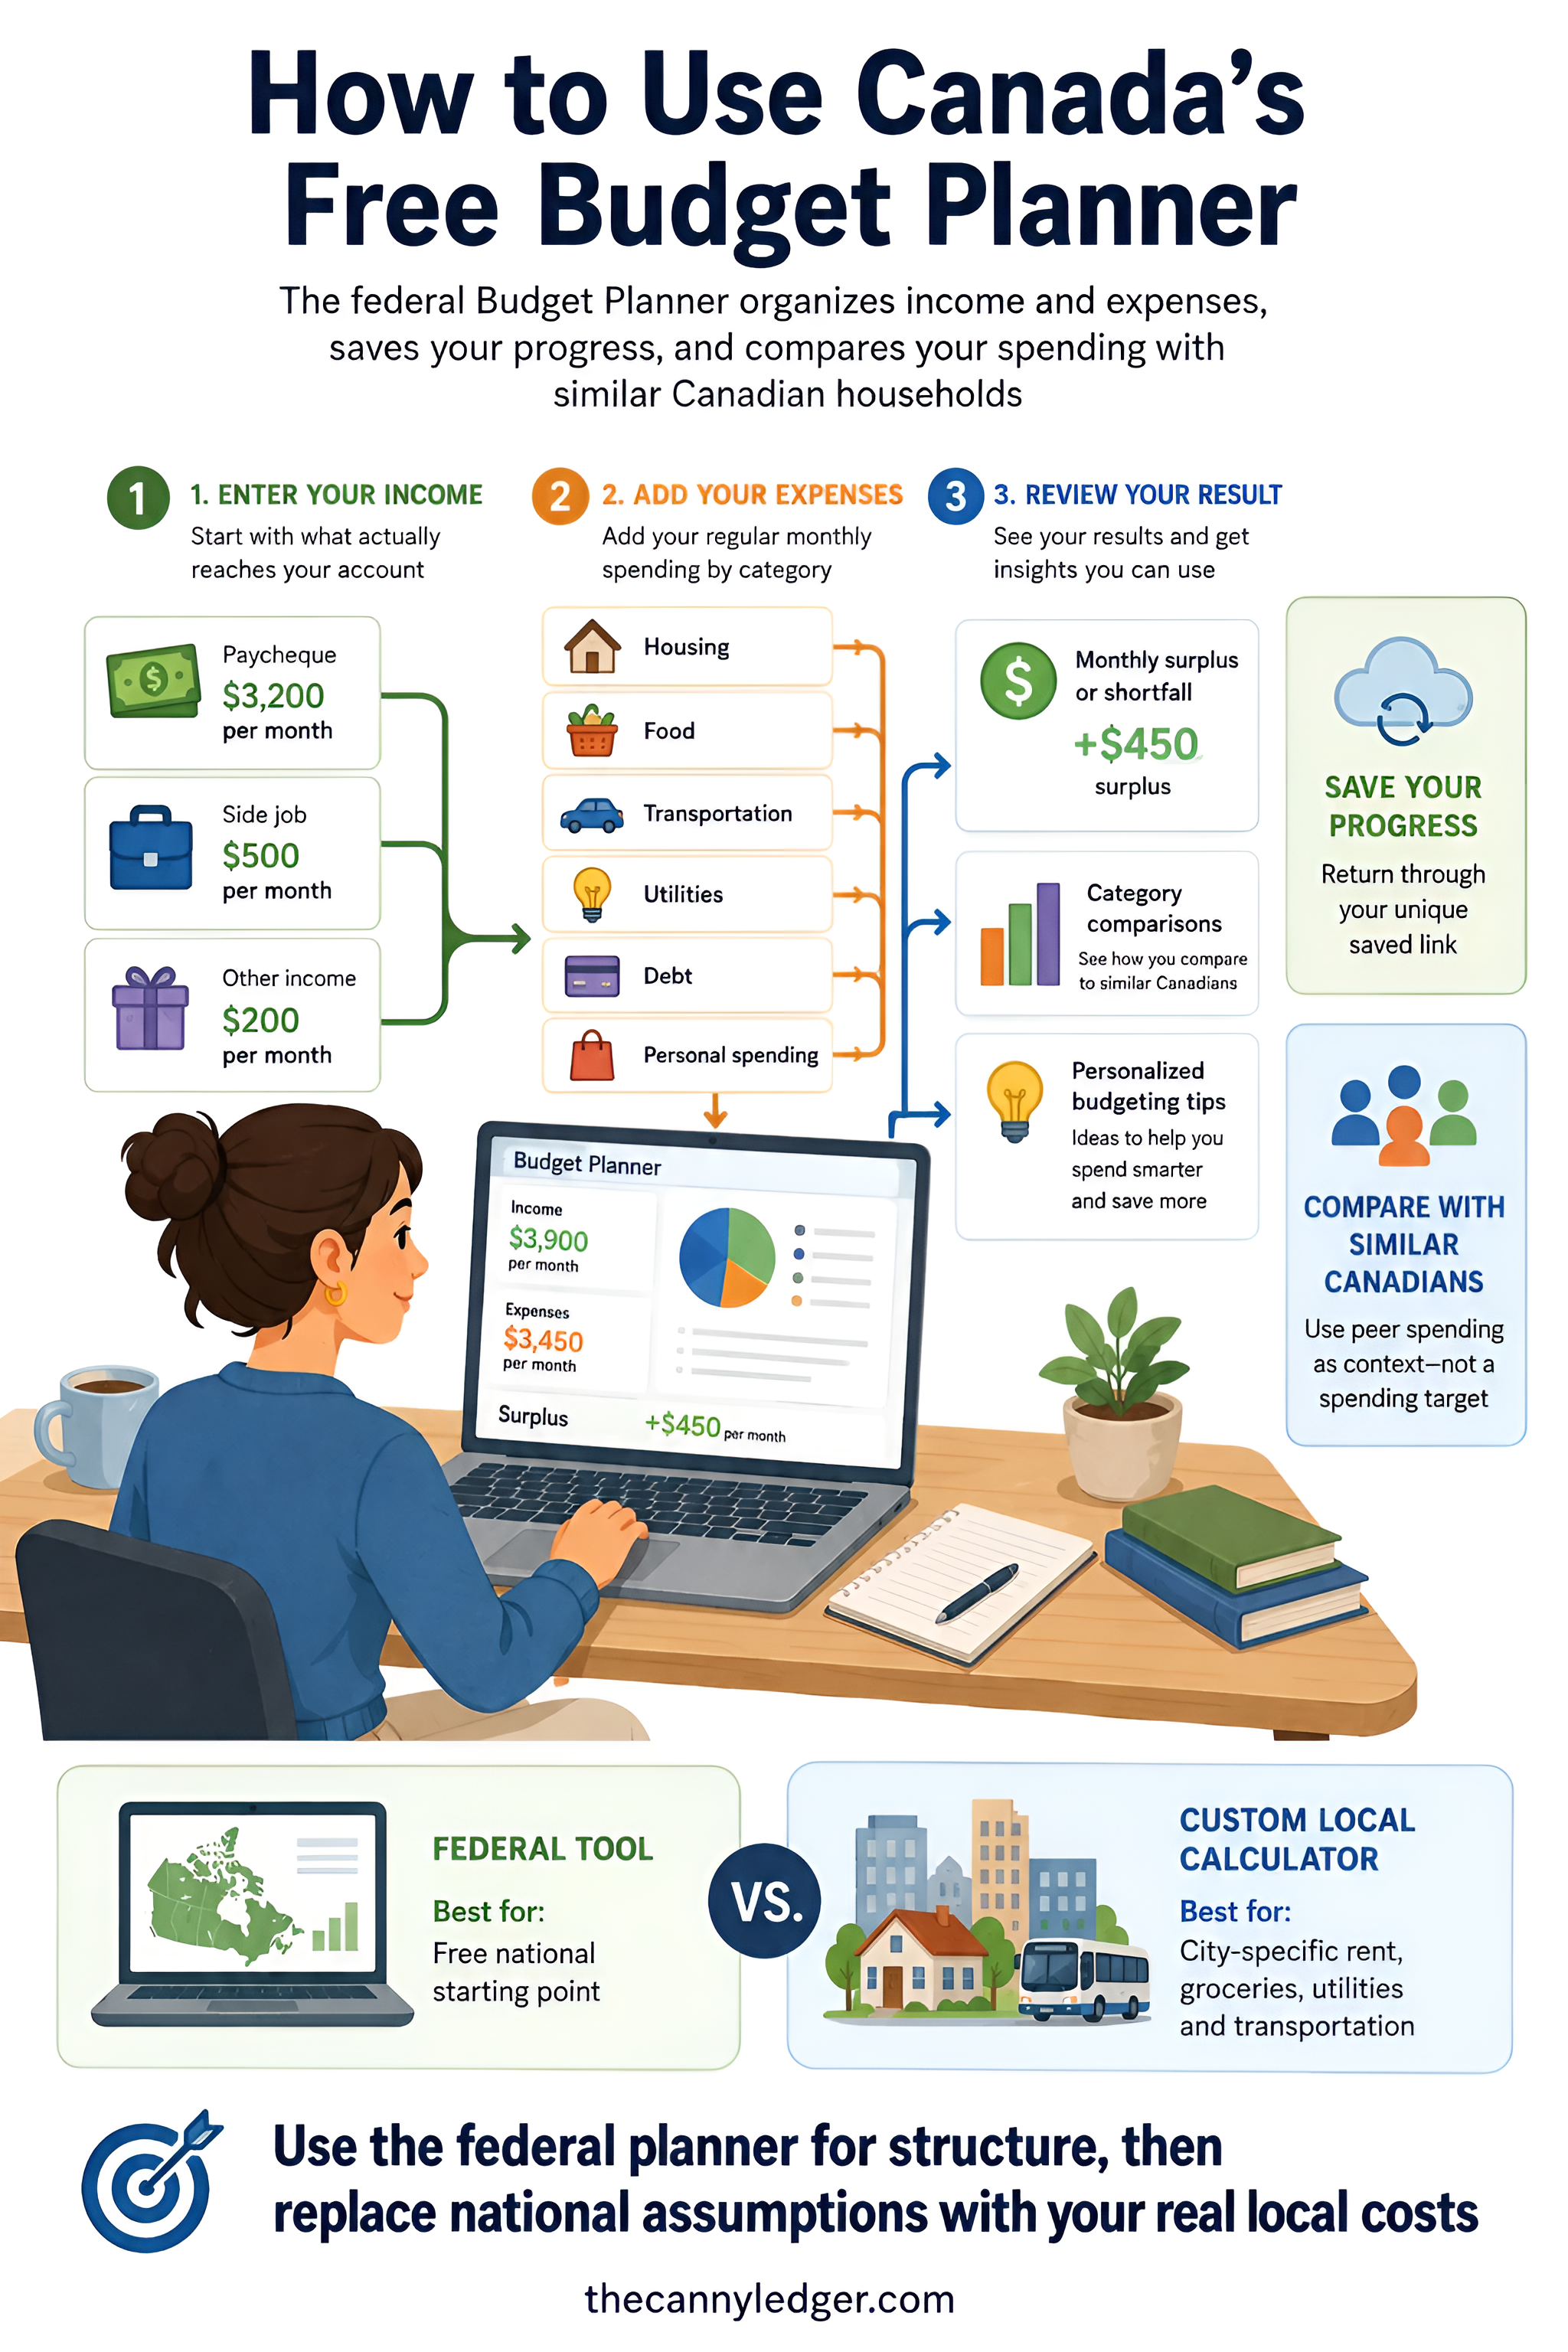
Before building anything from scratch, it’s worth knowing the Financial Consumer Agency of Canada maintains its own free Budget Planner tool, built using behavioural research into how people actually stick with a budget rather than abandon it after a week. It walks through income and expenses in three steps, saves your progress through a unique link so you can update it over time, and compares your spending against other Canadians in a similar situation. A government assessment of the tool found it genuinely effective enough to keep refining rather than replace, which says something about its underlying design even if the interface itself isn’t going to win any awards.
The FCAC tool is a strong starting point specifically because it’s free, current, and maintained by the same government body that tracks the spending data behind it. Since its 2019 launch, the tool has offered personalized tips and the ability to compare your budget against other Canadians in a similar life situation, a feature most private budgeting apps charge a subscription for. Where a custom calculator still earns its place is in tailoring the categories and defaults to your specific city, since a national tool necessarily works from national averages.
Building Your Own Calculator Step By Step
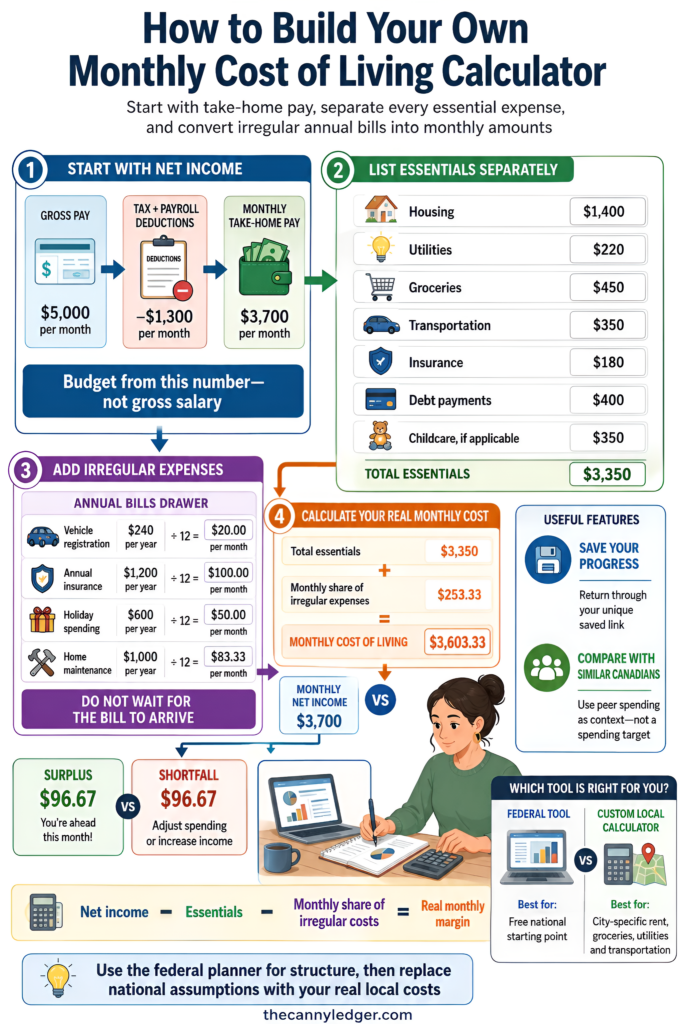
Start with net income, not gross, since budgeting against your take-home pay is the only version that reflects what actually lands in your account each month. List every essential category separately rather than lumping them together, housing, utilities, groceries, transportation, insurance, debt payments, and childcare if it applies, since a combined “living expenses” line hides exactly which category is actually the problem when the numbers don’t work.
The category most DIY calculators miss entirely is irregular expenses, the annual costs that don’t show up monthly but absolutely still happen, vehicle registration, an annual insurance premium if you don’t pay monthly, holiday spending, or a home maintenance reserve. Take each irregular cost, divide it by twelve, and add that monthly fraction into your calculator as its own line, a sinking fund in miniature. Skipping this step is the single most common reason a budget that looks balanced on paper still runs short every few months when a large annual bill lands unexpectedly.
Where Most DIY Budgets Quietly Fall Apart
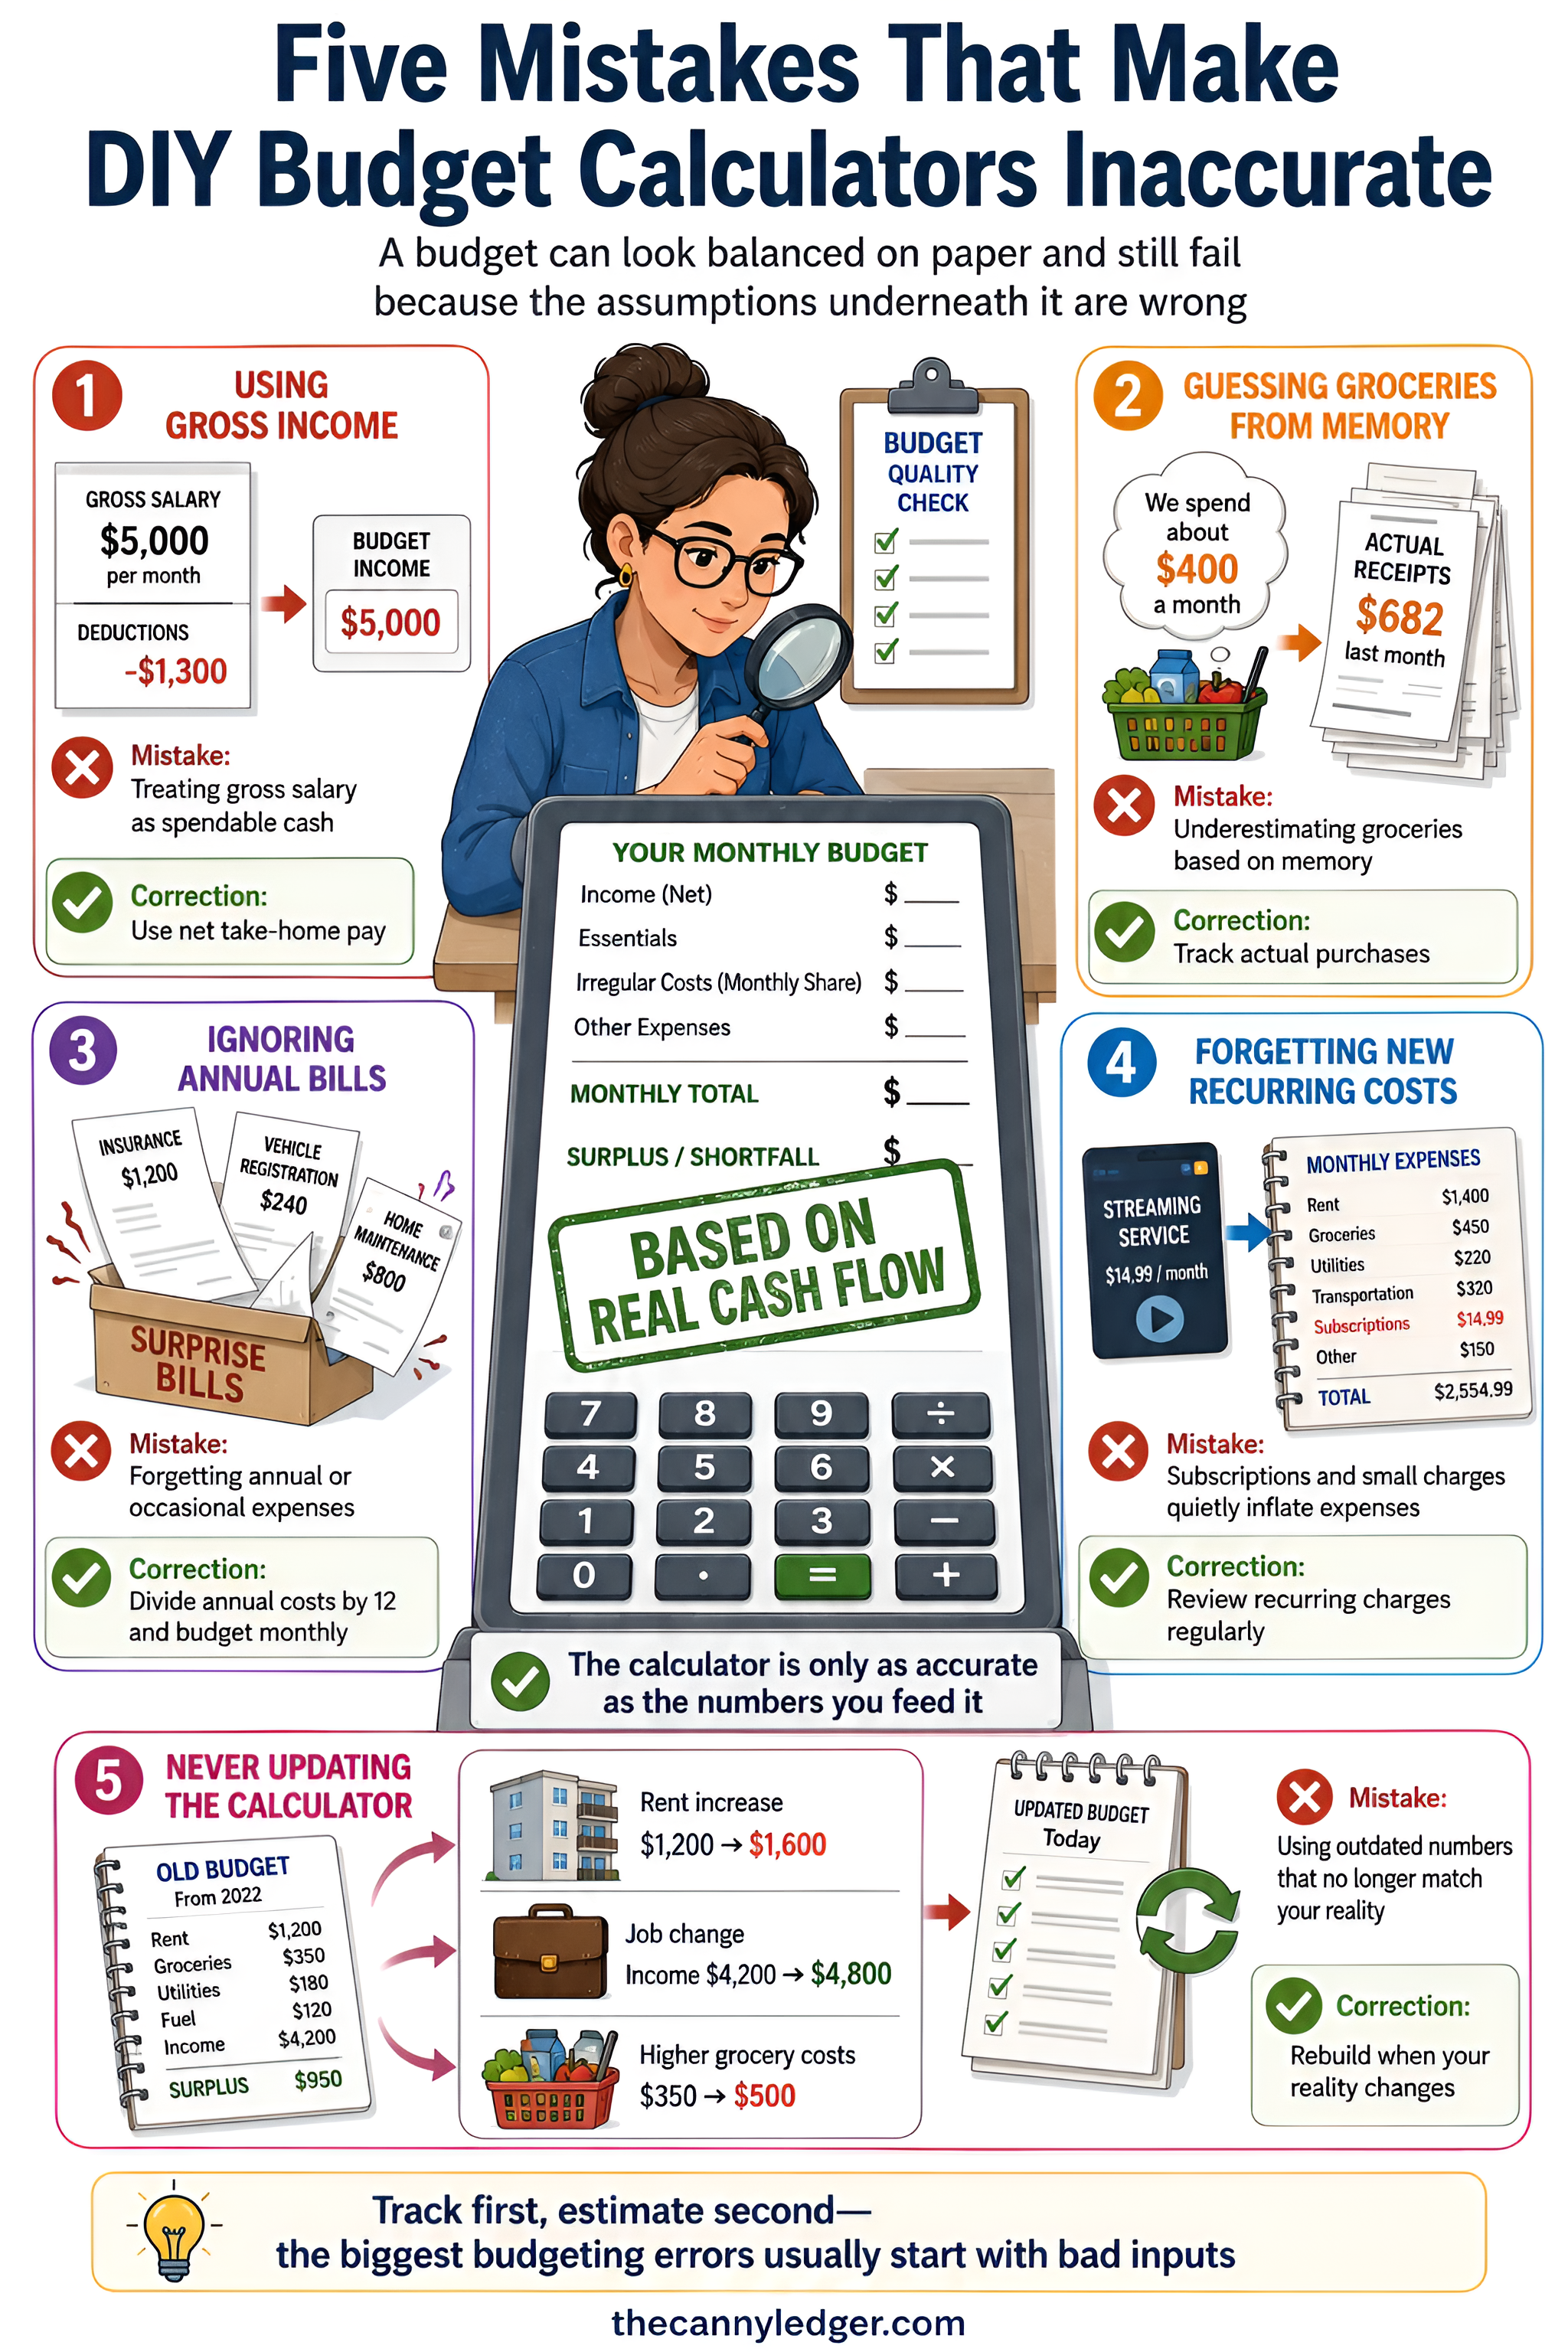
A handful of mistakes show up constantly in self-built calculators. Using gross income instead of net inflates every percentage-based rule and makes a tight budget look more comfortable than it actually is. Estimating grocery spending from memory rather than an actual receipt total tends to run low, since small individual purchases add up faster than most people expect. And building the calculator once and never revisiting it means it stops reflecting reality the moment rent renews, a job changes, or a new recurring subscription quietly joins the mix.
What To Do With Whatever Is Left Over
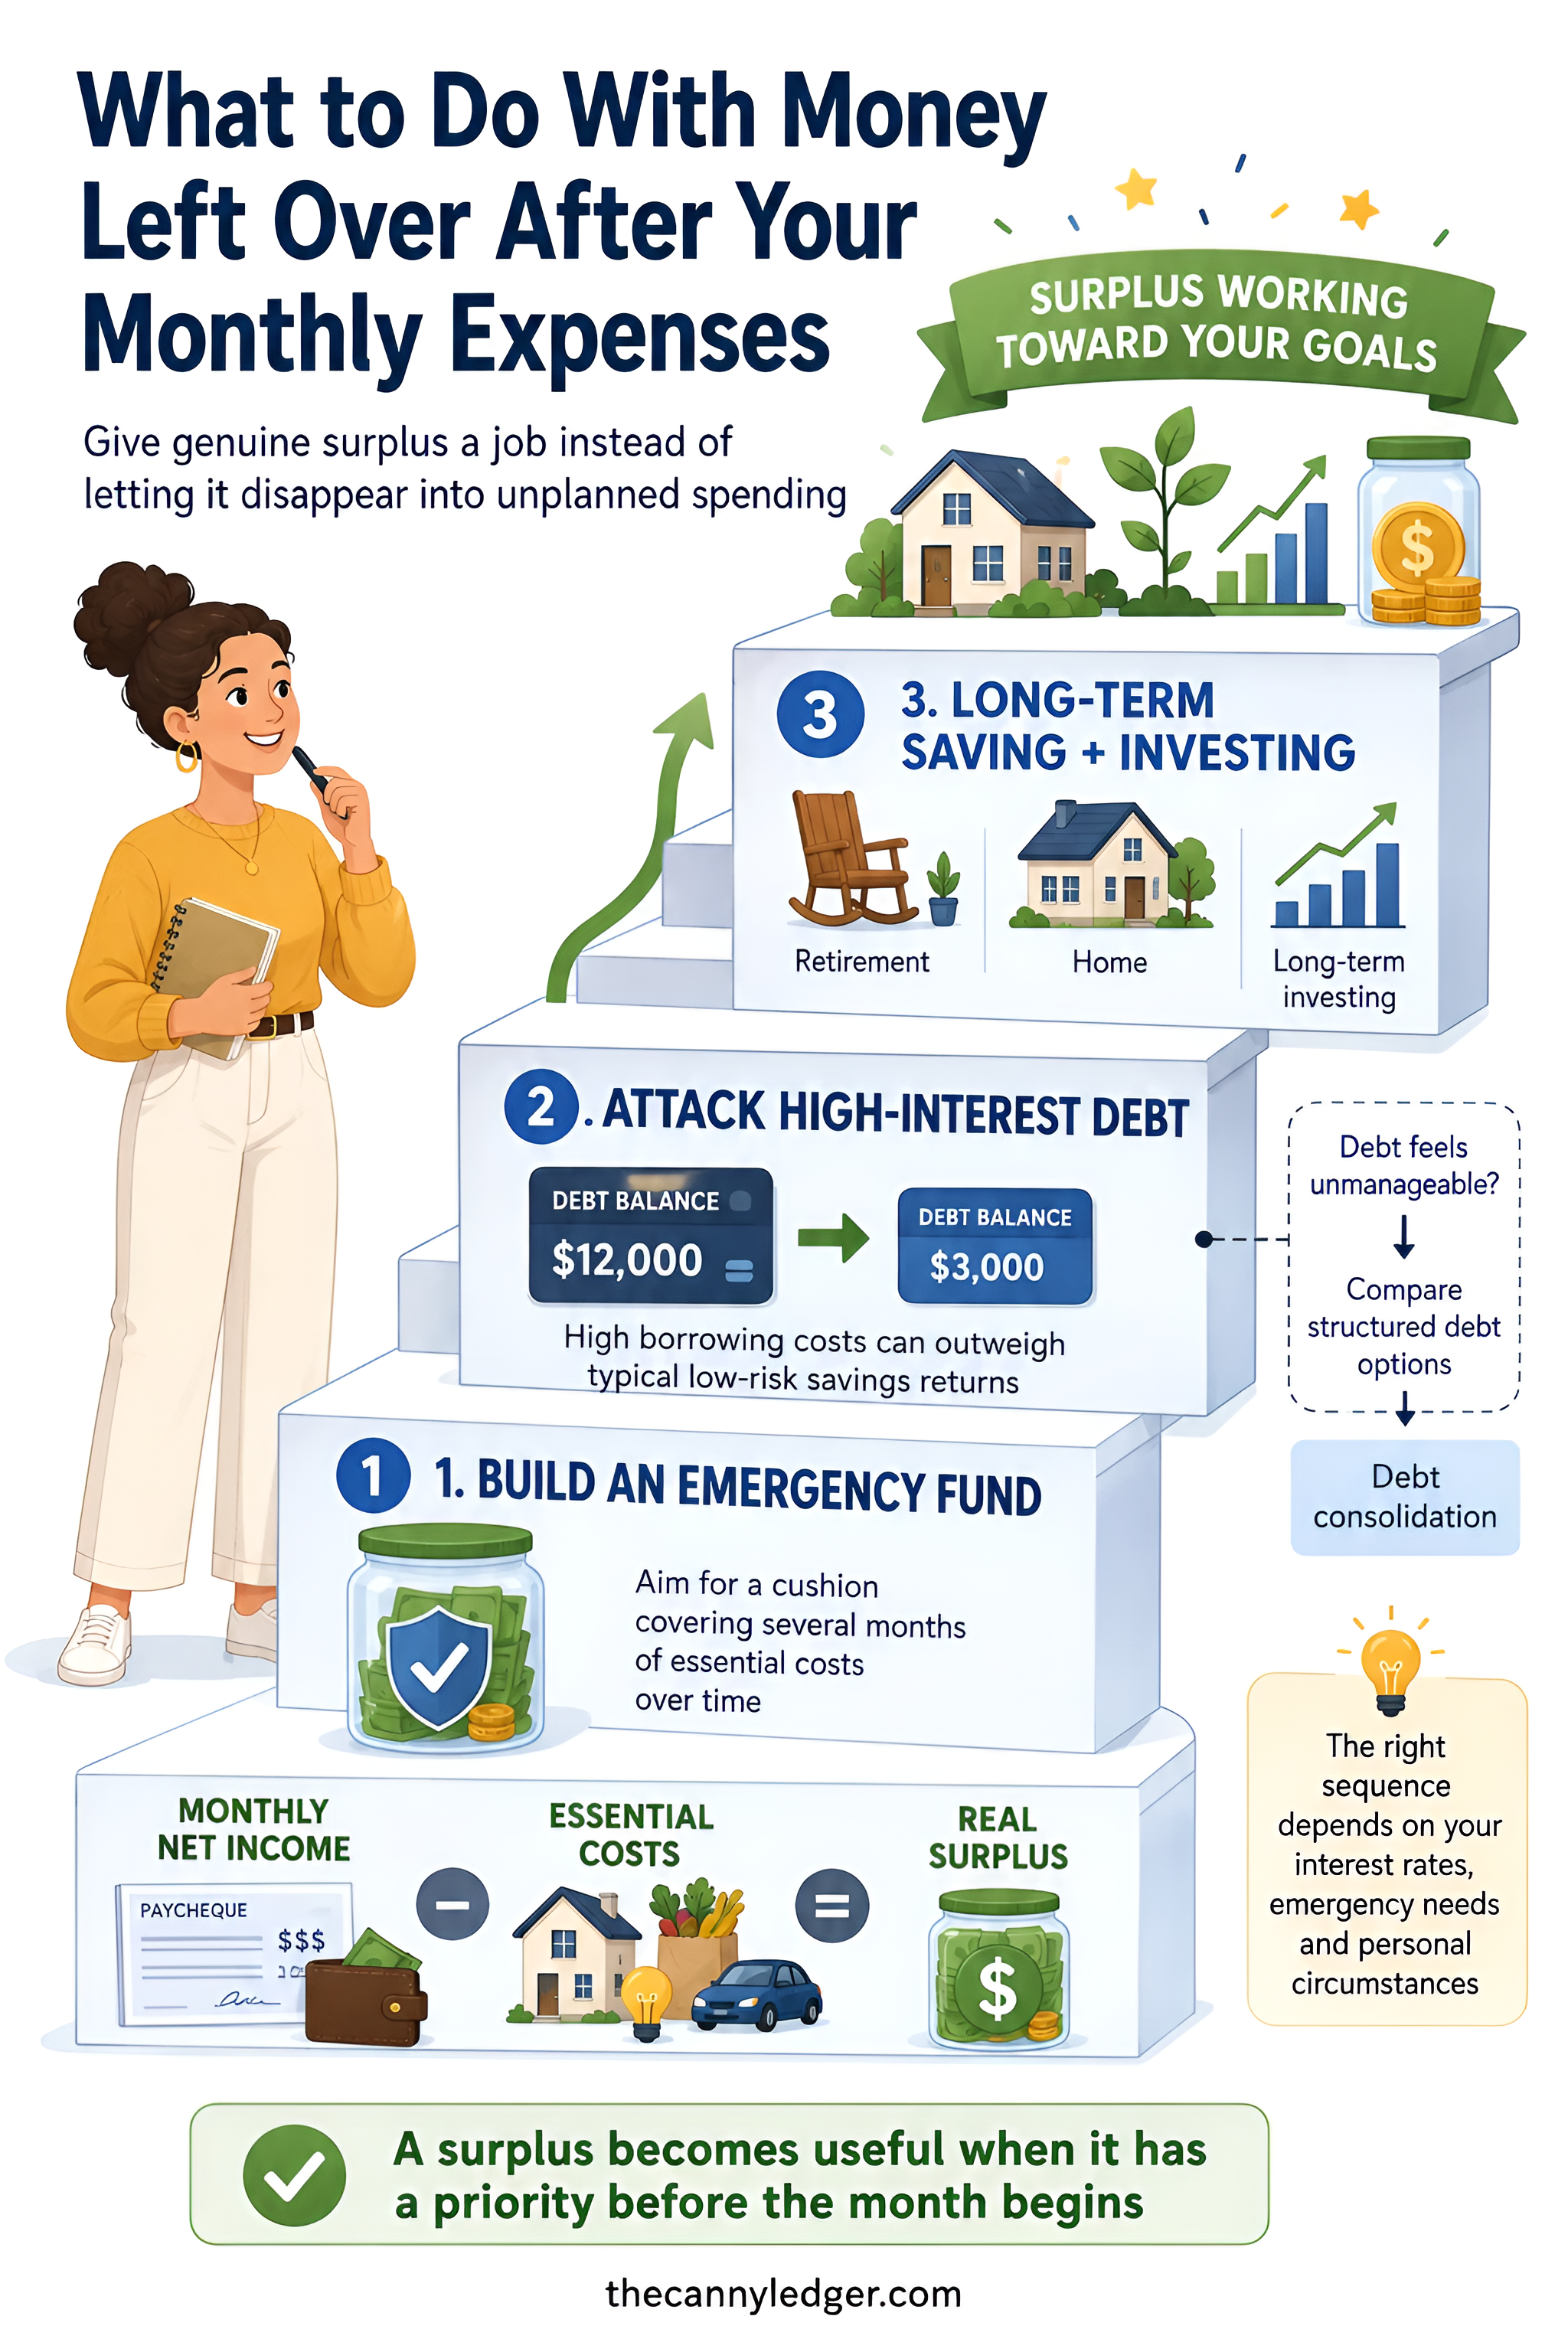
Once your calculator shows genuine surplus after essentials, a reasonable order of priority beats spending it without a plan. An emergency fund covering a few months of essential costs comes first, since that cushion is what prevents a single unexpected expense from becoming new debt. From there, paying down high-interest debt faster than the minimum typically outperforms most savings vehicles on a pure math basis, and if that debt load is significant enough to feel unmanageable through your own calculator alone, a structured option like debt consolidation is worth exploring directly rather than continuing to service several accounts at once. Once debt and an emergency cushion are both in reasonable shape, longer-term savings and investing become the more productive use of whatever’s genuinely left, and a financial advisor can help sequence that next stage properly rather than guessing at it.
Making The Calculator Something You Actually Use
Rebuild your numbers at least twice a year, since rent, grocery prices, and utility costs in Winnipeg specifically shift often enough that a calculator built a year ago is already working from stale assumptions. Track actual spending against your calculator’s estimates for at least one full month before trusting any of the categories fully, since the gap between what you assumed and what you actually spent is usually where the real insight lives. And treat StatCan’s own category percentages as your sanity check rather than the generic 50/30/20 split, since a Canadian household spending 32 percent on shelter alone isn’t doing anything wrong, it’s simply living in the country the data actually describes.