

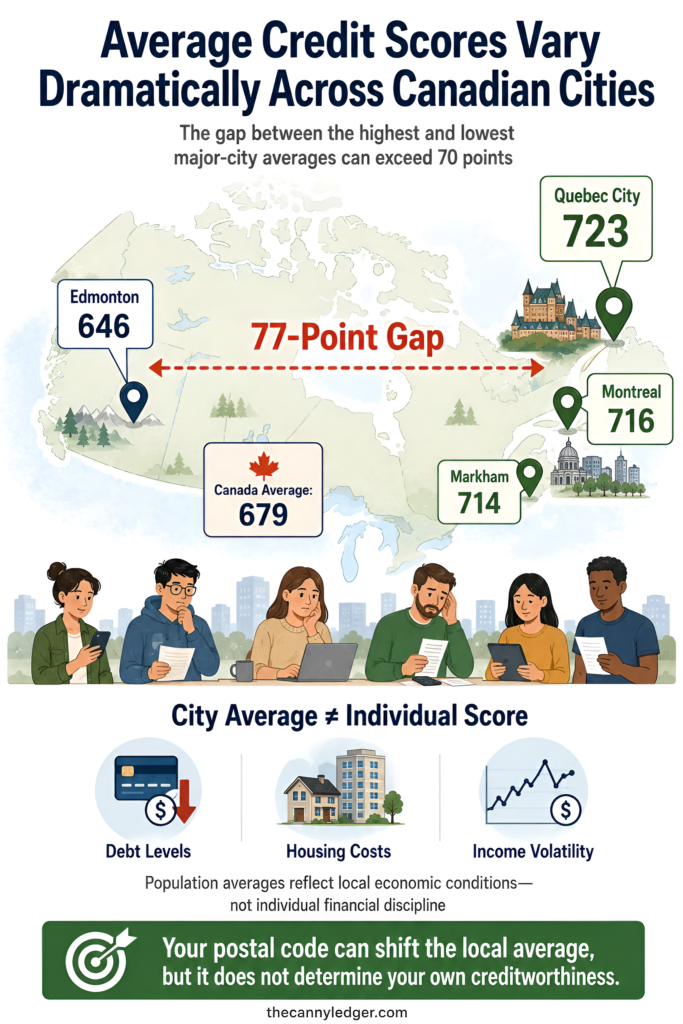
Quebec City’s average credit score sits at 723. Edmonton’s sits at 646. That’s a 77-point gap between two Canadian cities, wider than the distance most people would draw between a merely good score and a genuinely excellent one on the exact same national scale. “The average Canadian credit score” gets quoted constantly as if it’s one settled number, and it genuinely isn’t, not by bureau, not by age, and not by where you happen to live.
Breaking the number apart by geography, age, and time tells you something a single national figure never could, and that breakdown is where the real story lives.
Which Average You’re Even Looking At
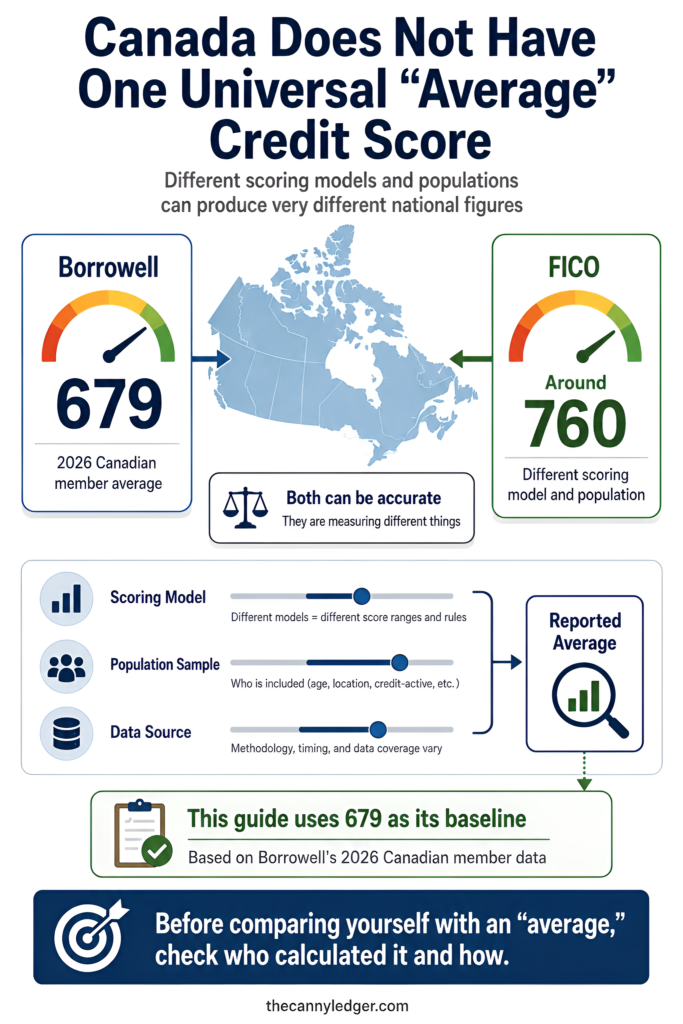
Different trackers report meaningfully different national averages, and our full credit score guide covers why FICO’s figure and Borrowell’s figure can differ by 80 points while both remain technically accurate. The short version worth repeating here is that Borrowell’s own 2026 data, drawn from over four million Canadian members, puts the national average at 679. That’s the figure this piece uses as its baseline throughout, since it’s the most current, broadly sourced number available and the one most free credit apps in Canada are quietly built around.
The City By City Spread
Borrowell’s 2026 study of Canada’s most populous cities lays the geographic spread out clearly. Quebec City leads the country at 723, followed closely by Montreal at 716 and Markham at 714, all comfortably in very good territory on Equifax’s scale. Edmonton sits at the opposite end at 646, with several other Prairie and Alberta cities trailing behind the national average as well. Quebec cities cluster disproportionately at the top of the list, while Alberta and parts of the Prairies cluster toward the bottom, a pattern consistent enough across multiple studies that it’s worth taking seriously rather than dismissing as noise.
None of this means an individual in Edmonton is somehow worse with money than someone in Quebec City. City-level averages reflect the aggregate financial pressures of a whole population, average debt loads, local housing costs, income volatility tied to specific industries, not the discipline of any single resident. A 646 city average still contains plenty of individual residents sitting comfortably in the excellent range, and a 723 city average still contains people struggling with a thin or damaged file. The number describes a population, not a person.
Why Age Explains More Of The Gap Than Almost Anything Else
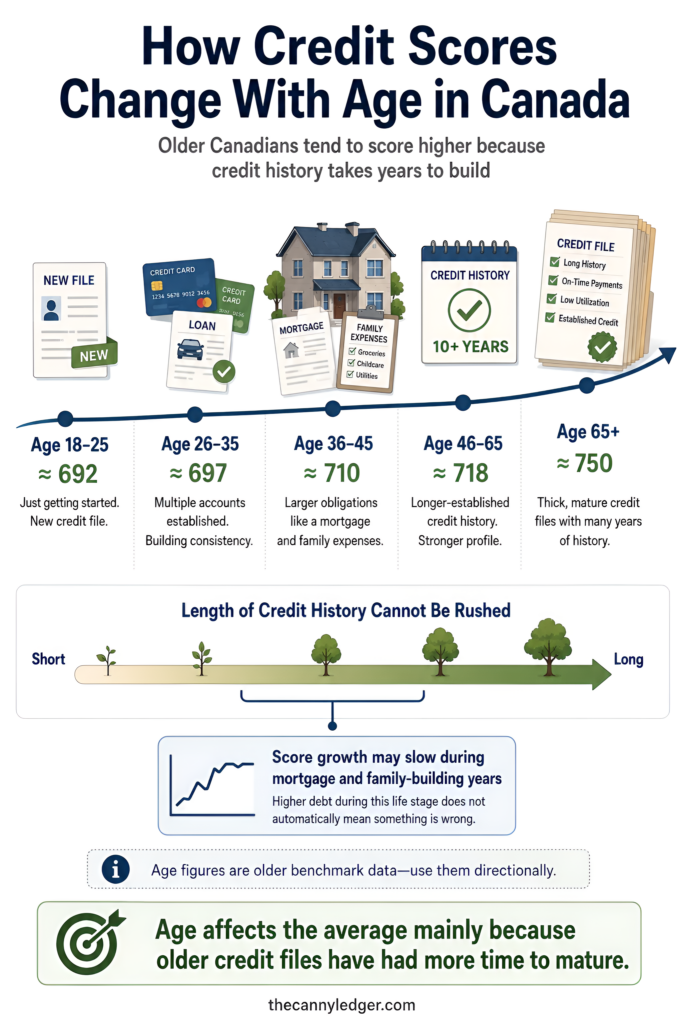
Age correlates with credit score more consistently than any other single factor Canadians can observe about themselves, and the reason is mechanical rather than a judgment about financial maturity. Length of credit history counts for real weight in how a score gets built, and that weight simply cannot be rushed. According to the most recent detailed age breakdown available, drawn from Equifax data and reported by NerdWallet Canada, young adults aged 18 to 25 average around 692, climbing to 697 for those 26 to 35, 710 for 36 to 45, 718 for the 46 to 65 bracket, and 750 for Canadians over 65. This specific breakdown dates to 2018, the most recent detailed generational data publicly available, so treat the exact numbers as directional rather than precise for the current year, though the underlying pattern, older brackets scoring meaningfully higher, has held consistently across every study since.
One wrinkle worth knowing about sits in the middle of that curve rather than at either end. Canadians in their mid-30s to mid-40s often see their score growth slow or briefly plateau, not because anything’s going wrong, but because this stretch of life tends to concentrate the biggest financial moves at once, a first mortgage application, a growing family’s expenses, and simultaneously higher total debt than any other stage of life. That temporary flattening isn’t a red flag on its own. It’s what happens when a life stage and a scoring model’s mechanics collide.
The National Number Has Actually Been Climbing
A genuinely underreported trend deserves real numbers attached to it. Borrowell’s own member data shows the national average rising from 667 in 2021 to 679 in 2026, a 12-point climb over six years. That’s a real, sustained improvement, not a rounding artifact, and it’s happened during a stretch that included a pandemic, a sharp rate-hiking cycle, and now a historic wave of mortgage renewals landing at meaningfully higher payments. Our piece on mortgage renewal covers that renewal pressure directly, and it’s worth noting that the national credit average climbing through this exact window suggests most Canadians have managed that pressure without it showing up as widespread credit damage, at least not yet at the aggregate level.
That doesn’t mean every tracker tells the same story. Some FICO-based reporting has actually shown a slight recent dip rather than a climb, attributed to the same cost-of-living pressure and renewal wave, a reminder that which population a given tracker samples, and which bureau it draws from, can point the trend line in opposite directions even when both are describing the same underlying economy.

What The Average Actually Tells You About Your Own Number
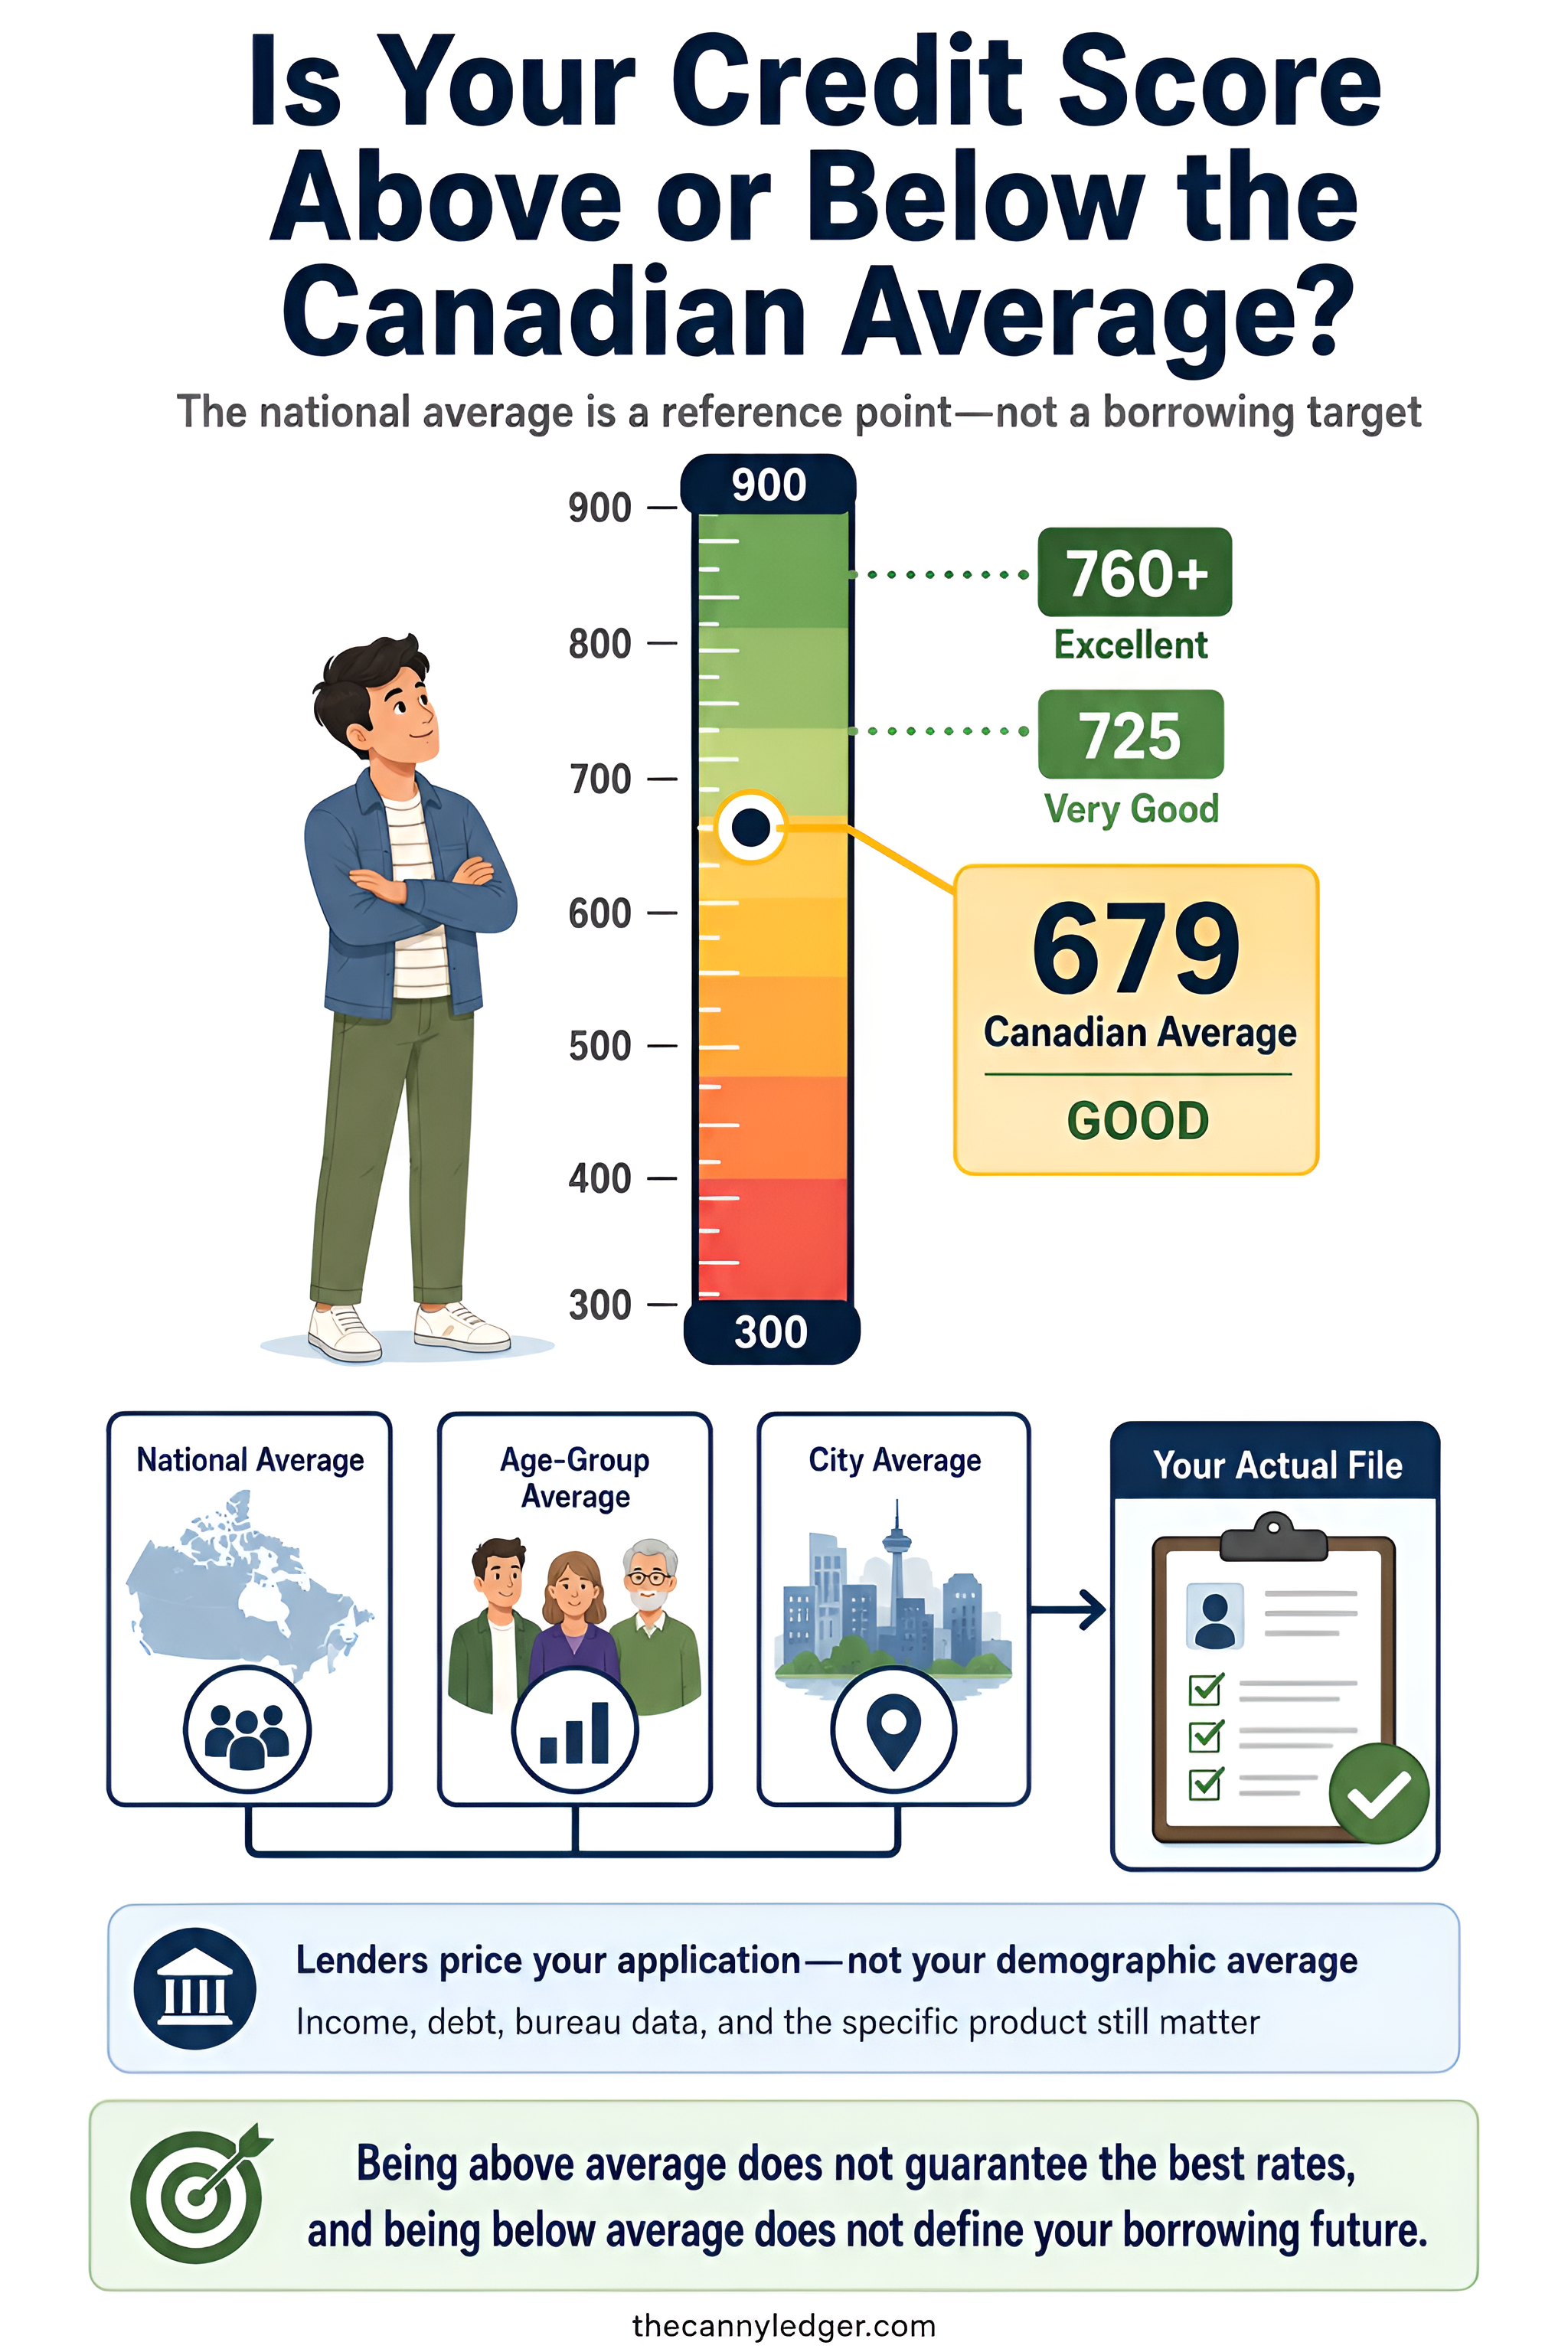
Sitting above the 679 national average puts you ahead of roughly half the country in a loose sense, but it says nothing about whether you’re actually positioned for the products and rates you want. The average sits solidly in the good range on Equifax’s scale, comfortably approved for most standard credit products but well short of the very good and excellent tiers where the genuinely best rates live. Our breakdown of what counts as a good credit score in Canada covers exactly where those tier boundaries sit and what changes as you cross each one.
Treat the average as a reference point for calibration, not a target to coast toward. A city average, an age-bracket average, and the national figure are all useful for understanding where you sit relative to a specific group, but none of them tell you what rate a specific lender will actually offer you, since that depends on your individual file, not the population you happen to belong to.
Where That Leaves You
Check your actual score through Canada’s credit bureaus rather than assuming the national average applies to your situation, since your age bracket and city alone can shift a reasonable expectation by 50 points or more in either direction. If you’re younger and sitting below the national figure, treat that as the expected starting point rather than a warning sign, and focus on the fundamentals covered in our guide to how credit scores are calculated rather than chasing the number a much older demographic naturally reaches first. And if you’re building a file from nothing, whether as a young adult or a newcomer to Canada, our guide to building credit from scratch lays out a realistic timeline for closing that gap instead of comparing yourself against an average that took someone else decades to reach.